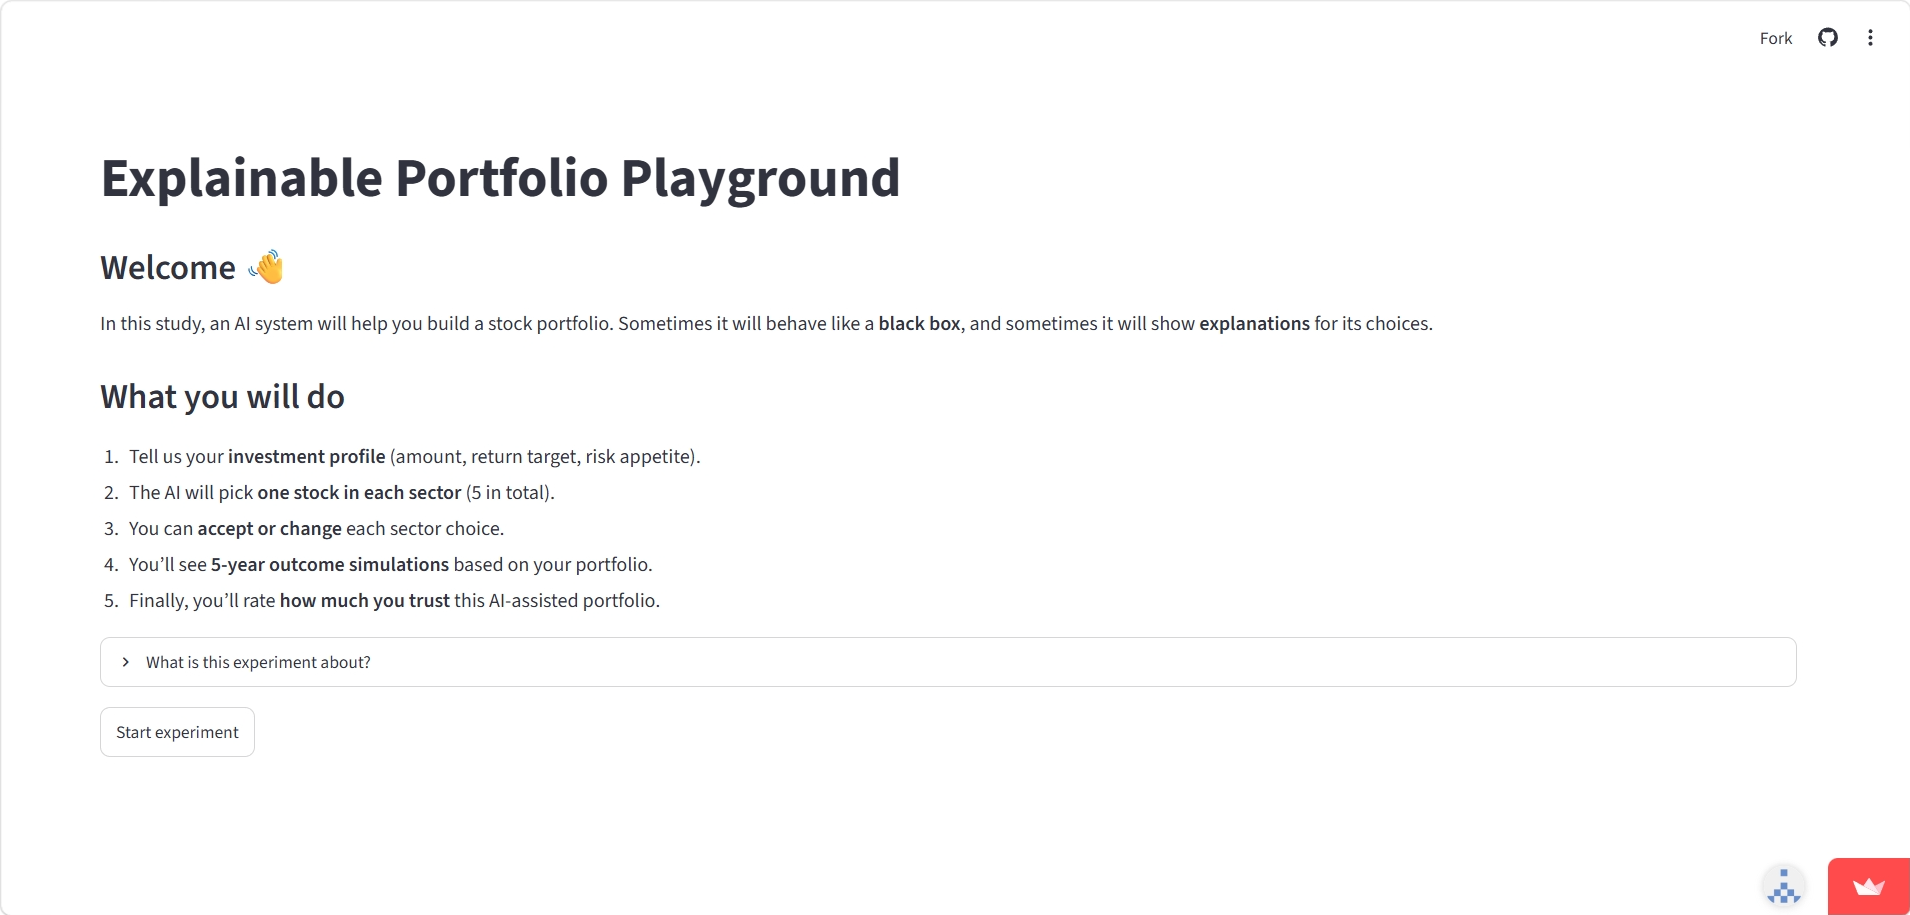
This project explores whether explaining an AI recommendation changes how people understand it and how much they trust it. I was interested in a question that goes beyond whether an AI system can produce a recommendation: can the person using it understand the reasoning, question the suggestion and make their own decision?
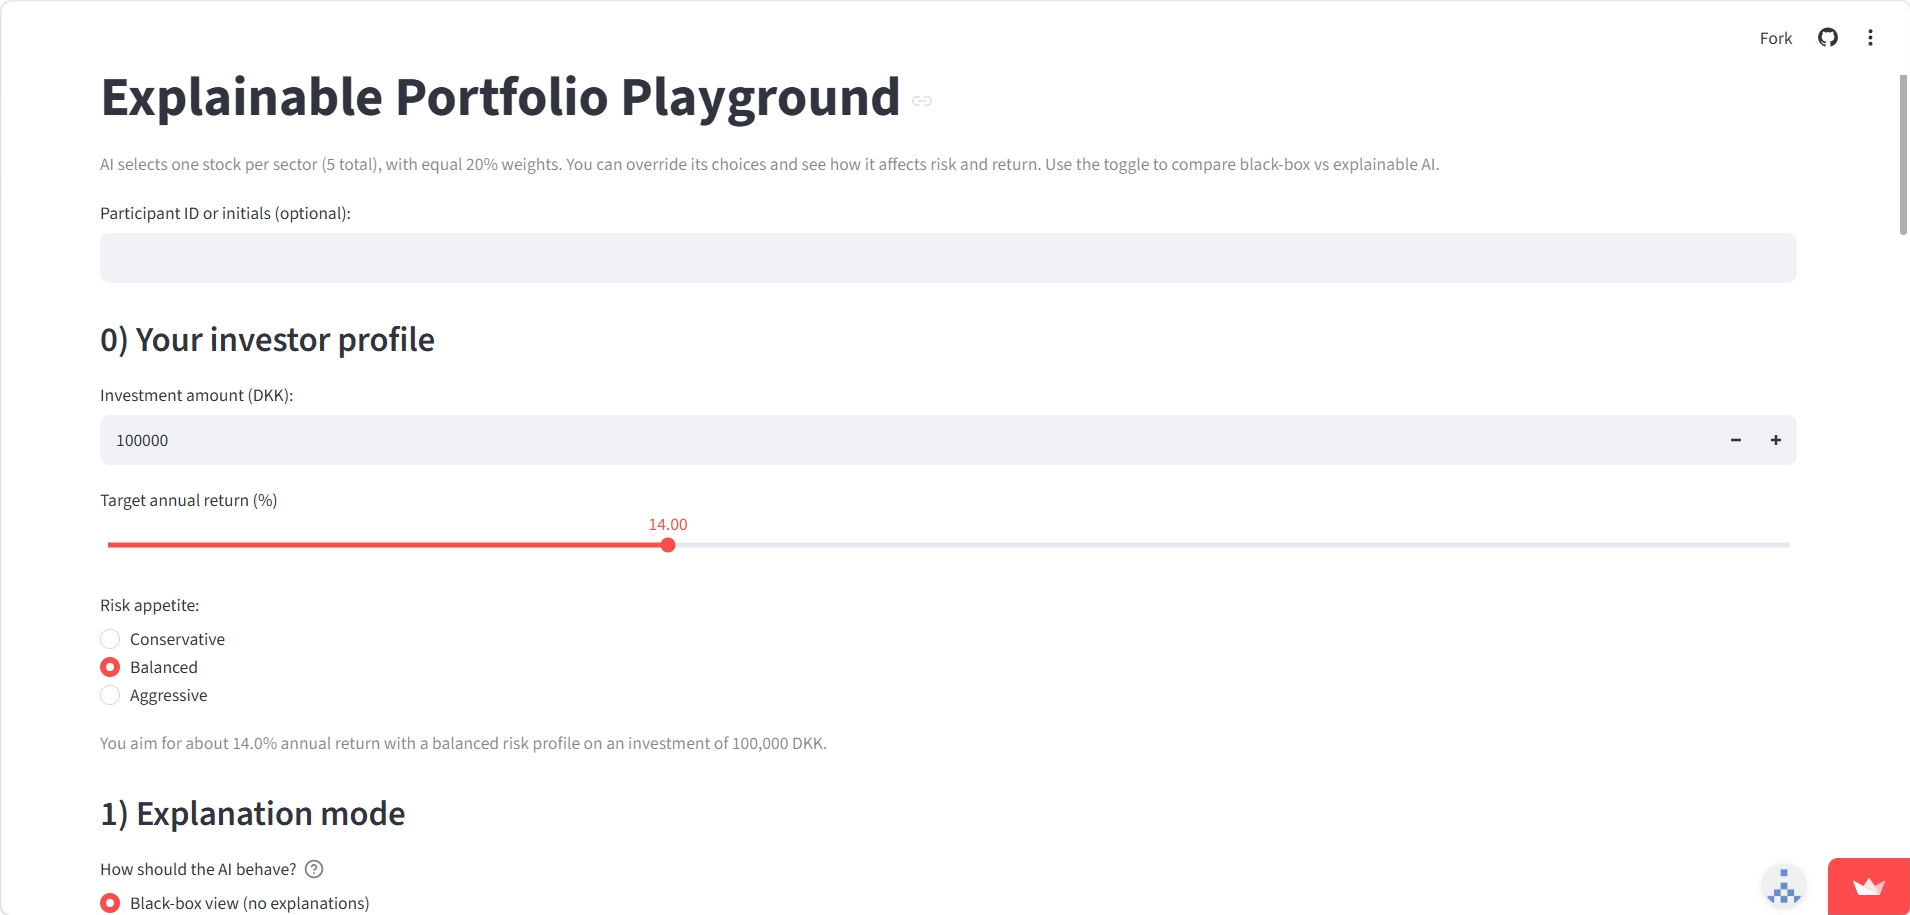
To explore this, I built an interactive portfolio experiment in Streamlit. Participants experience either a black-box recommendation or an explainable version of the same process. The app collects their investment preferences, suggests a five-stock portfolio, presents possible five-year outcomes and asks them to evaluate how much they trust the recommendation.
Try the live Streamlit prototype
The experience
The app suggests one stock from each of five sectors. For every sector, the participant can accept the AI suggestion or select the alternative stock. The projected portfolio results then reflect those choices. At the end, the participant rates how much they trust the portfolio and how likely they would be to act on it.
What the black-box view leaves out
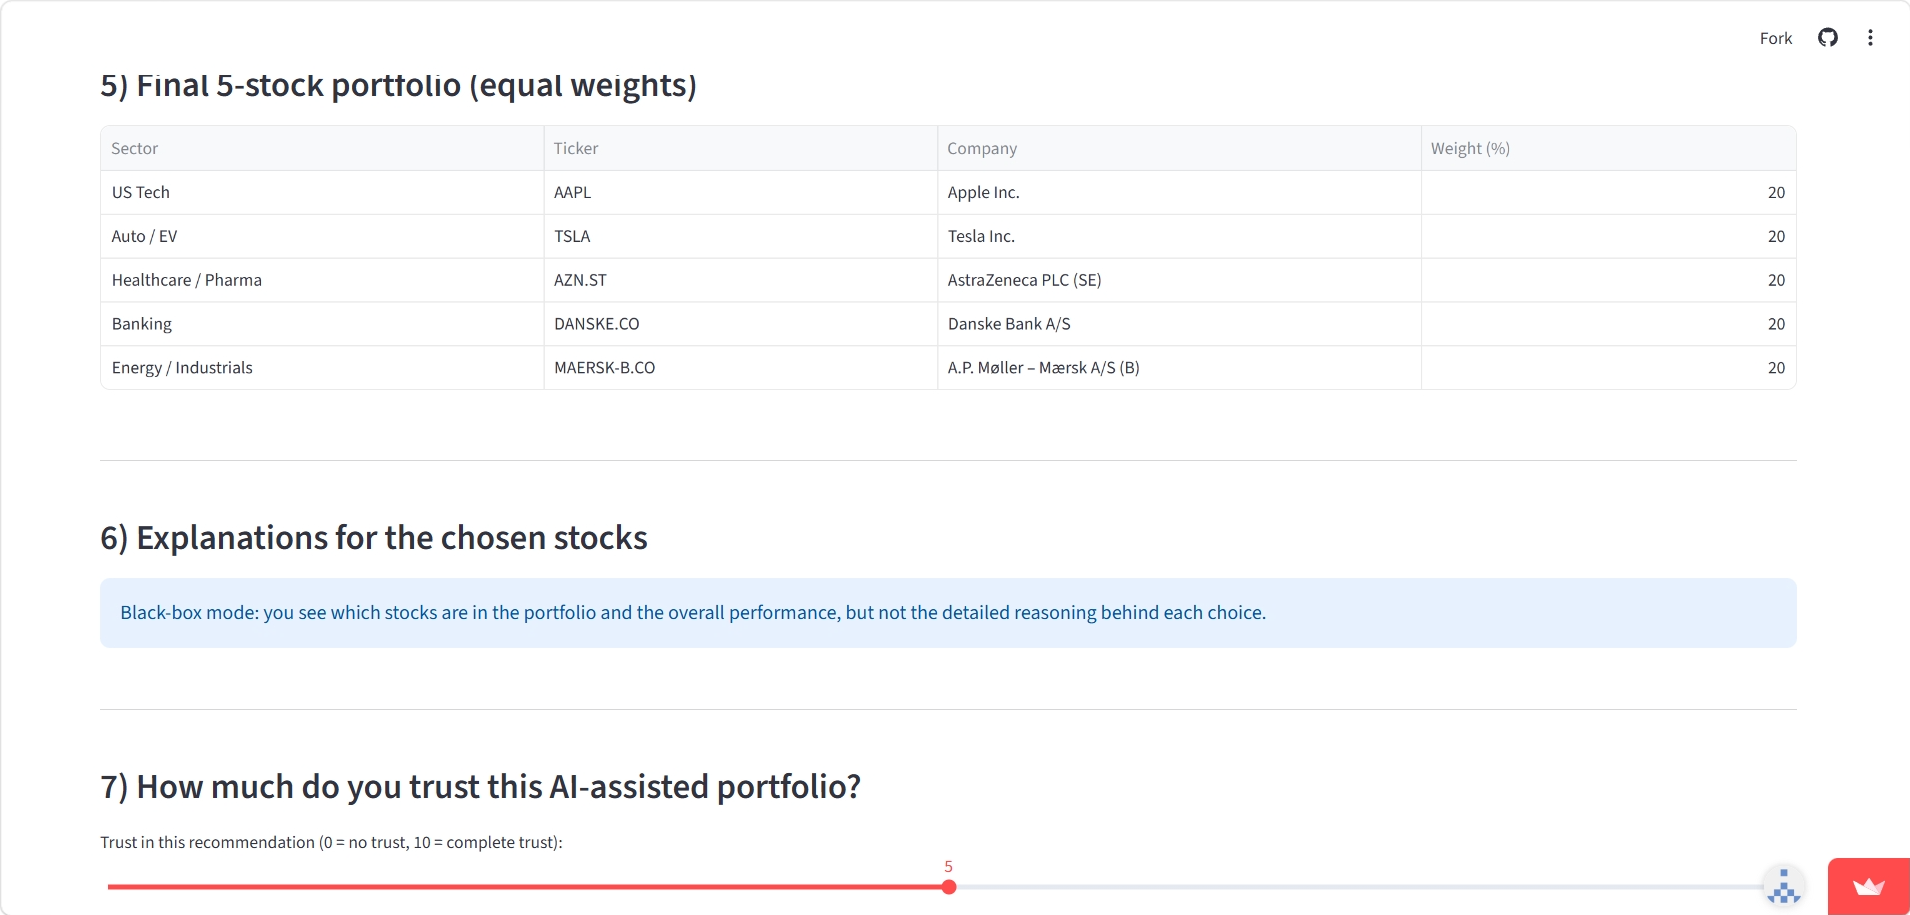
In black-box mode, the user sees the selected portfolio and its overall scenarios without detailed reasons for each stock. Trust and willingness to follow the suggestion are then rated on separate scales. This makes the absence of explanation visible as part of the experience.
What the explainable view adds
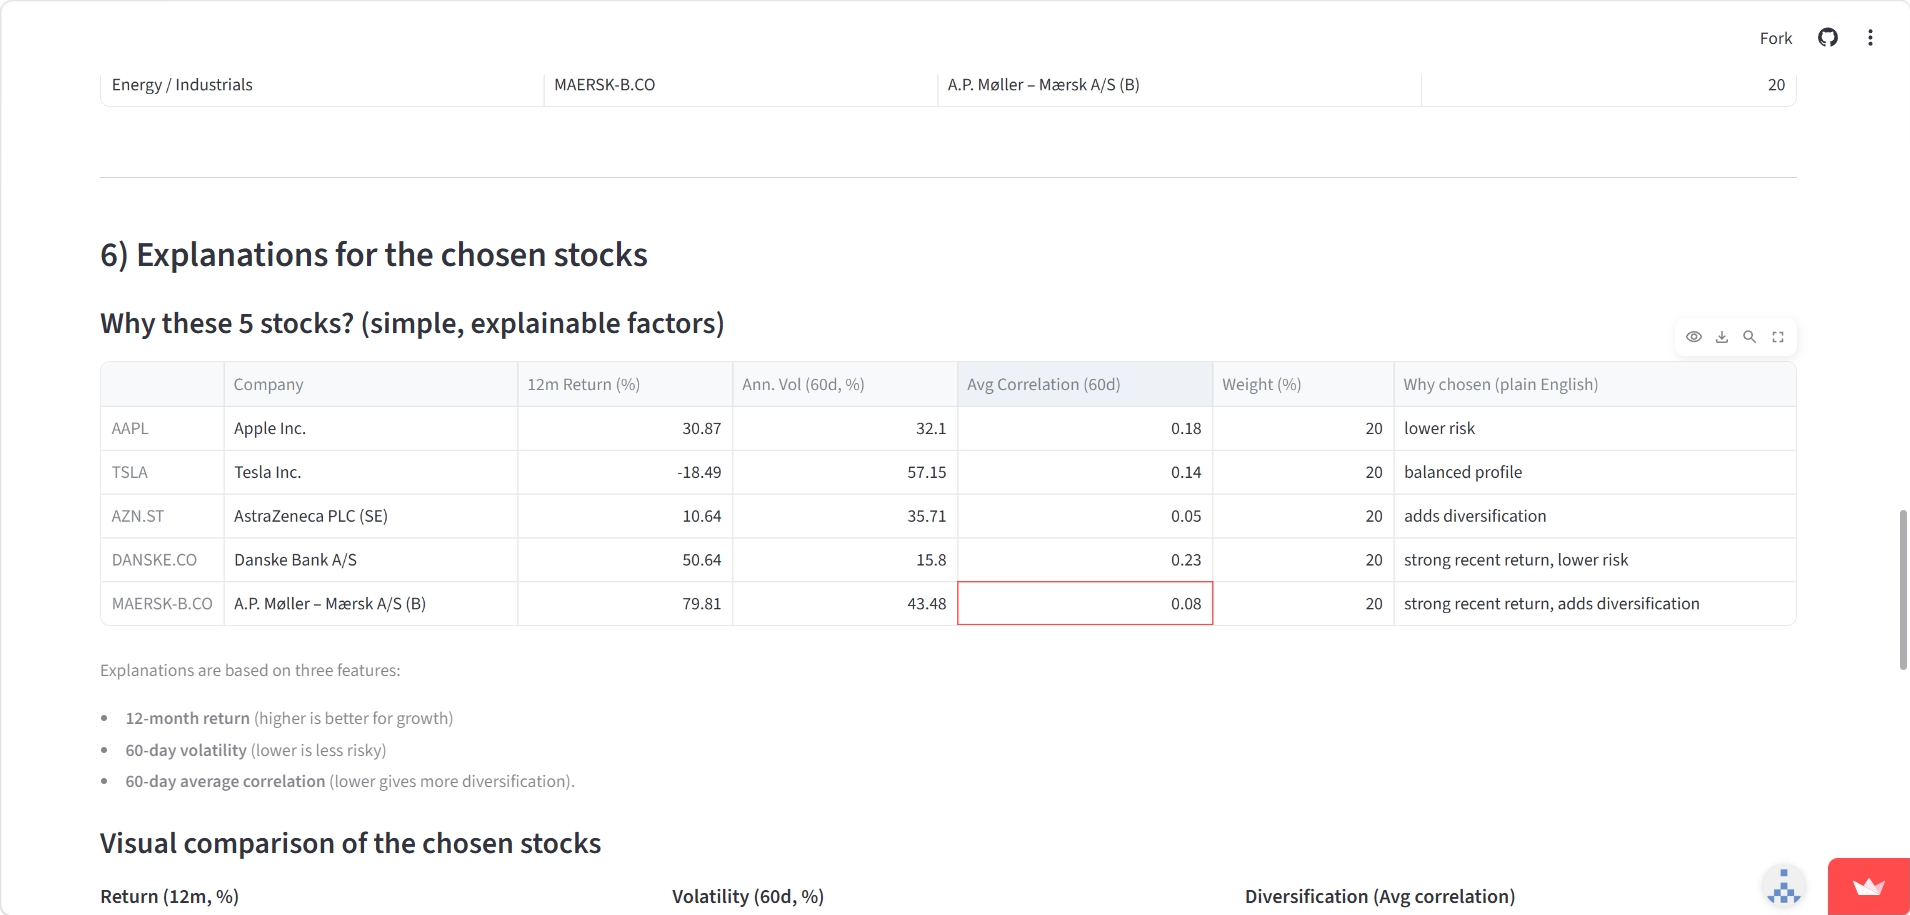
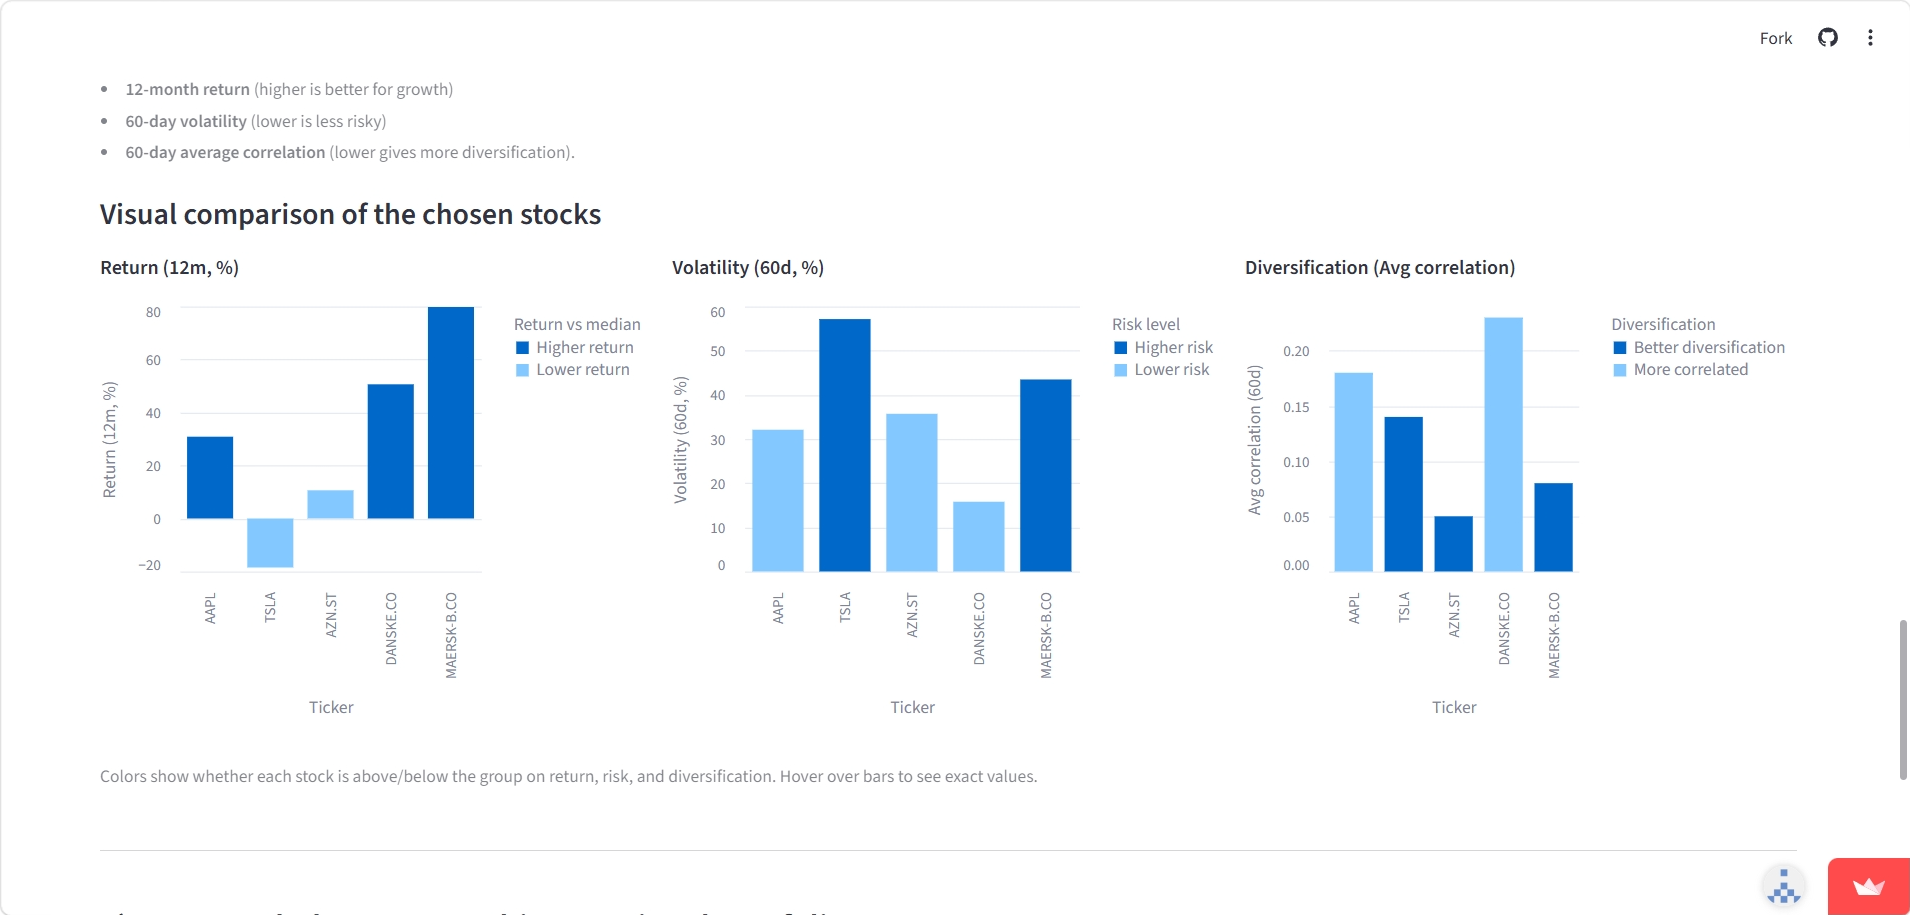
The explainable view shows plain-language reasons alongside three displayed factors: 12-month return, 60-day volatility and average correlation. The user can compare why a stock appears in the portfolio, while retaining the ability to choose another option.
Making uncertainty visible
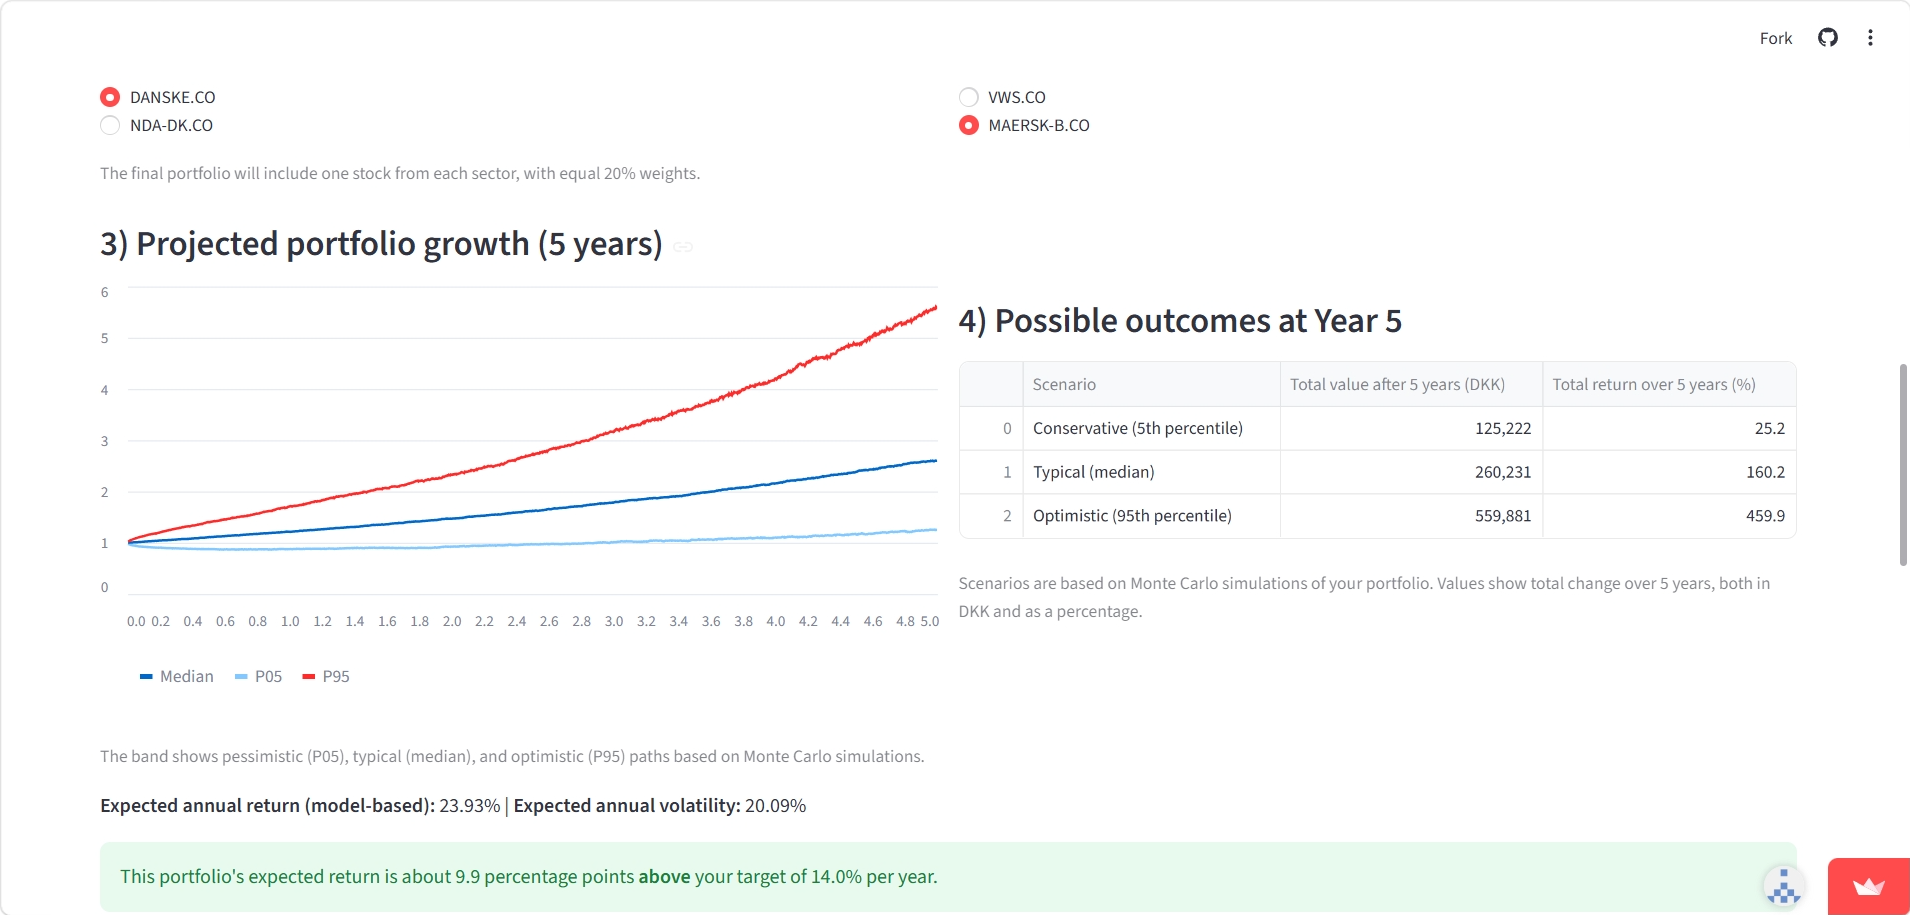
The five-year chart uses Monte Carlo simulations to show pessimistic, median and optimistic paths. These are illustrative model scenarios rather than reliable predictions of future returns. In the case study, they demonstrate how a decision interface can communicate a range of possible outcomes.
What I learned
An explanation is useful only if it helps someone question the recommendation, not merely accept it. This prototype brings recommendation, override, scenario and trust rating into one flow. It is an exploratory experiment, and the screenshots do not establish that explanations improved trust or decision quality. That would require participant responses and a defined evaluation.
Early response
7/10
Trust in the recommendation
One participant completed the black-box condition and rated their trust in the AI-assisted portfolio at 7 out of 10. This is an early observation from a sample of one, so it does not yet show whether explanations change trust.